Notes about algorithmic trading
These are my notes about algorithmic trading. I am writing these down, because finding any structured information that is not already outdated and correct at the same time is pretty hard.
Disclaimer: Do not use this information as investing advice, i.e. do not put real money in a system described on this page. The information here is for educational purpose only.
By “structured”, I mean a structured overview over all topics and how they can be pigeonholed into the current trading landscape.
For example, everyone knows what SMAs are, that they used to work for automatic trading and that this is no longer the case. But why did they work in the first place? When did it stop working? And why? And what are the alternatives? And how can you determine if an alternative is viable?
These are the questions that I am trying to answer here for myself and anyone that is interested.
TODO Things to write about
- Criteria for a working trading strategy
- Is more data really always better?
Why algorithmic trading is not that easy, on the example of the SMA ()
The SMA can be used in a trend following system, where you buy or sell whenever two SMAs cross, e.g. SMA(10) and SMA(30). Consider the following 1min chart of USD/CAD:
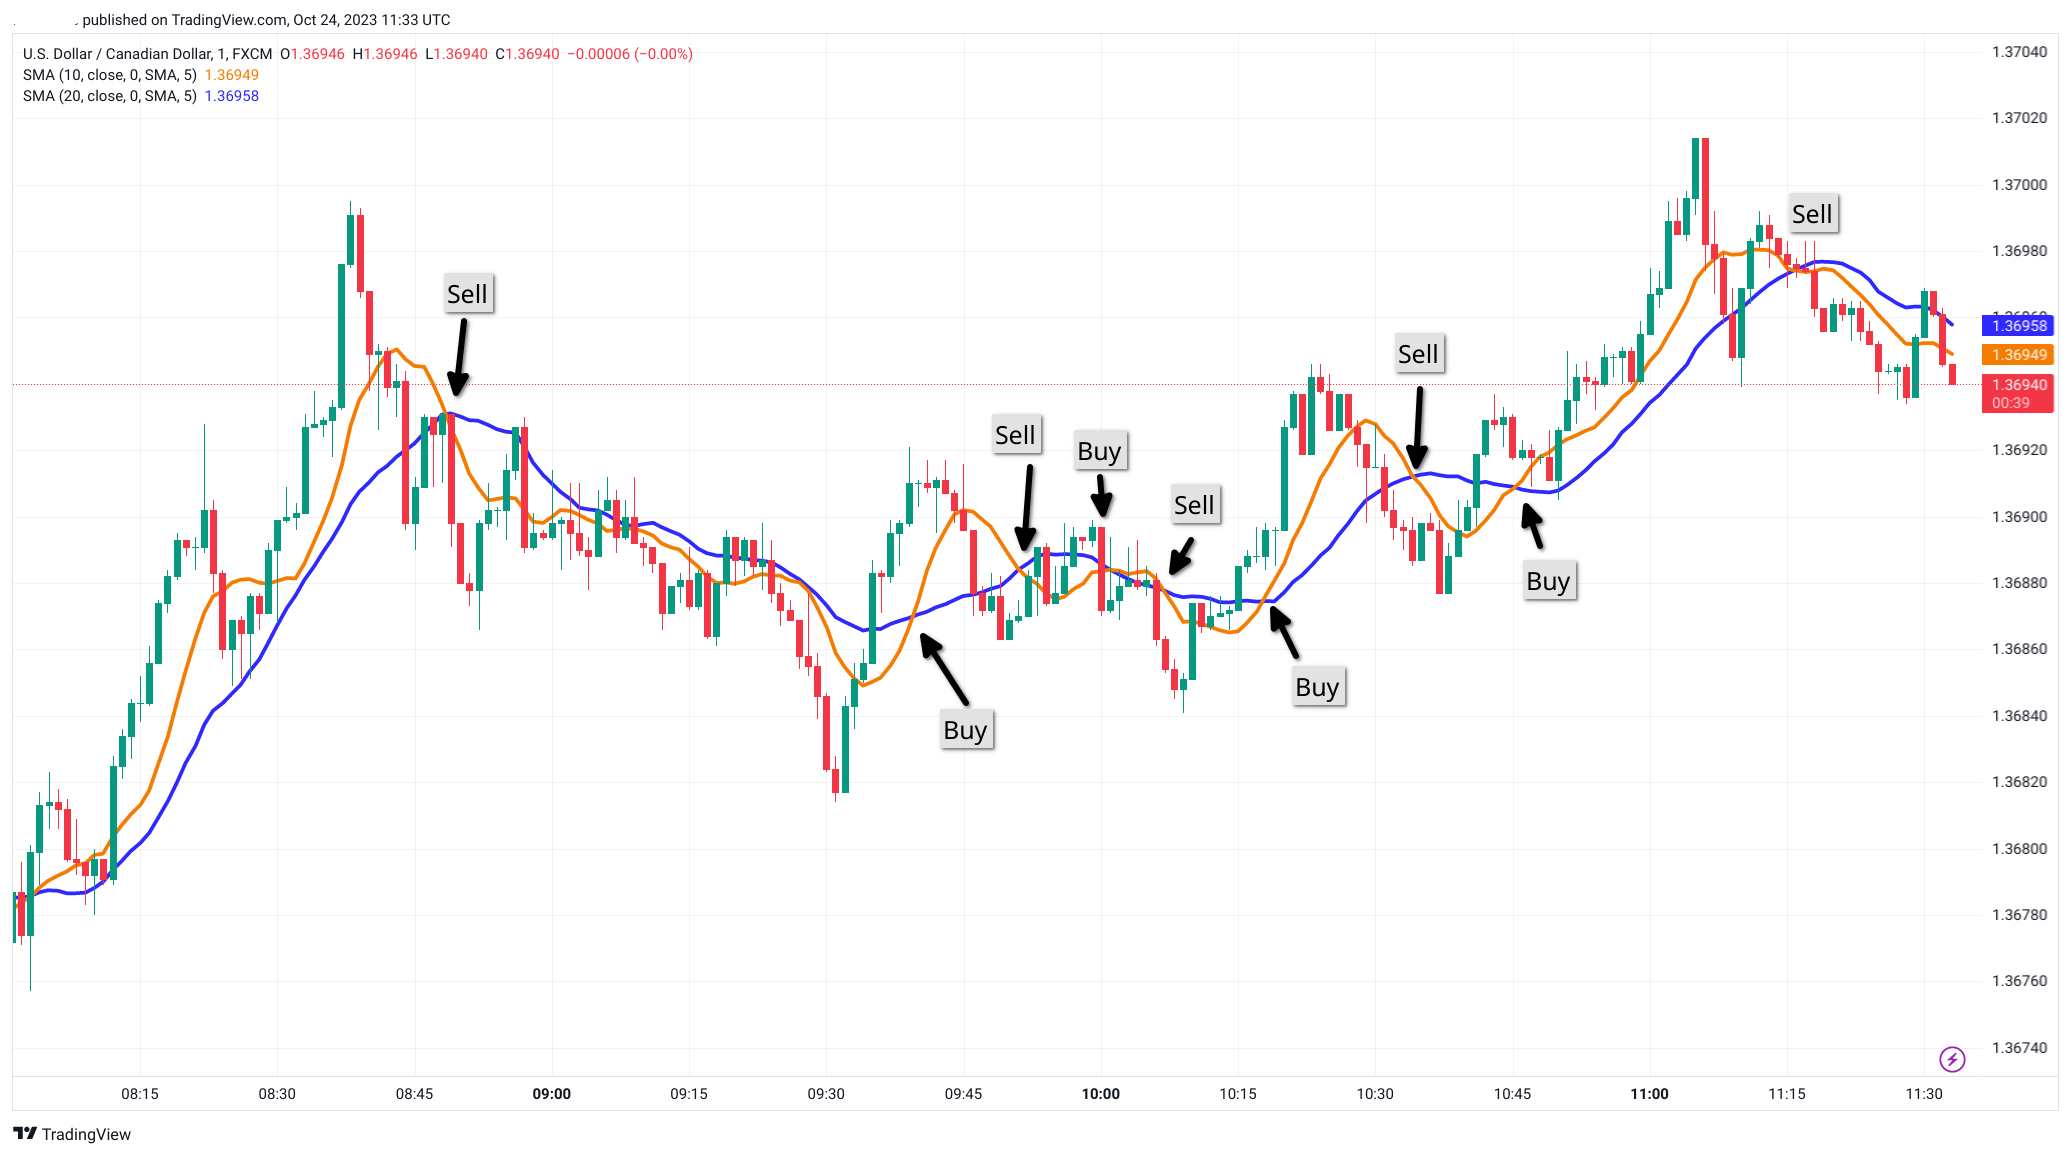
The screenshot shows the 1-minute candles, with a SMA10 (orange) and a SMA20 (blue), from 2023-10-24, 08:15, UTC+1. The basic assumption of the SMA is that it shows the general trend, with a bit of a delay, given how moving average works. With a trading system like this, the idea is to sell when the slower (orange) SMA crosses the faster (blue) SMA from above.
These points are indicated in the screenshot by arrows, and as you can see, even in the very short timespan of 3 hours this system would create multiple trading signals.
Now, if you would use these signals in their order, that is open a position on “sell” and close it on “buy”, you would lose with all positions instead of the first one.
However, if you open a short position on sell, set a defined limit and stop, and do the same on “buy” with a long position, for 8 out of the 9 entry points you would make money here. Consider a system running with a target profit of 10 CAD and a risk of 5 CAD per trade, with a position size of 1. Let’s look at the data:
| Time | Direction | Entry | Stop | Limit | Closed | Result |
|---|---|---|---|---|---|---|
| 08:48 | short | 1.36891 | 1.36941 | 1.36791 | 10:23 | - 5 CAD |
| 09:40 | long | 1.36911 | 1.36861 | 1.37011 | 10:07 | - 5 CAD |
| 09:52 | short | 1.36870 | 1.3692 | 1.3677 | 10:18 | - 5 CAD |
| 10:02 | long | 1.36875 | 1.36825 | 1.36975 | 11:00 | 10 CAD |
| 10:07 | short | 1.36853 | 1.36903 | 1.36753 | 10:20 | -5 CAD |
| 10:18 | long | 1.36898 | 1.36848 | 1.36998 | 11:05 | 10 CAD |
| 10:35 | short | 1.36887 | 1.36937 | 1.36767 | 10:52 | -5 CAD |
| 10:46 | long | 1.36918 | 1.36868 | 1.37018 | 12:16 | 10 CAD |
This data assumes:
- The position is opened 1 candle after the crossover, that is, for a short we use the low of the candle and for a long the high.
- The price is always the worst in that timeframe.
- The risk is set to 5 CAD fixed.
- The Limit is set to 10 CAD fixed.
In total, we lose 25 CAD, but gain 30 CAD. That makes a net profit of 5 CAD, right? Sadly, it’s not that easy.
- We did not consider spread; on my broker is is typically around 1.5 CAD. That means we have to add 8x1.5 CAD to the costs, that means: 30 CAD - 25 CAD - 12 CAD = -7 CAD.
- Depending on where you live, your result may worse. In Germany, you will have to pay about 25% of taxes on the winning trades, with no regard if you lost money at the end. That means you would end up with -14.5 CAD.
Can the system be adjusted? Well, looking at the chart we can see that there is more potential in the winning trades than 10 CAD and that we could use a closer stop to minimize losses. Assuming a risk of 3 CAD per trade and a target of 15 CAD, we would get 15.5 CAD profit, or 4.25 CAD in Germany.
What about risk?
You may wonder if the stop in this table is incorrect, because you read on so many sites that you should risk 1% (or 0.5%) of your capital, which would require adjusting the stop everytime. Is this so?
It’s not, because risking 1% of your capital everytime would result in you being out of money sooner or later, regardless of how good your strategy is.
Profit over a day
We looked at a timeframe of about 4 hours. If we make 15.5 CAD in 4 hours, can’t we just apply this system to 24 hours and make 93 CAD per day? Afterall, forex is traded around the clock. We can’t, because the trading volume is not the same during every hour of the day.
But let’s assume we trade it during the main hours of the market, e.g. from 08:00 to 20:00. That would mean 12 hours, so 46.5 CAD per day, therefore 232.5 CAD per week, or 930 CAD per month.
Sounds to good to be true? Because it is.
Issues
The first issue we are facing here is that the trades overlap; if you look closely at the times in the table, you will see that multiple positions need to be open at the same time. This has an impact on your margin and means that you will require 3 or 4 times the trading capital in your account, compared to strategies where you would have only one open position at the same time.
How long does this work?
The second question is: How long does this work? What if the market “changes” in some way where this system just stops working? How much money are you willing to lose before abandoning the system?
Or, to phrase it differently, how much money are you willing to burn before you make profits?
In the table above, we reach break-even after 6 trades. We make money with the 8. trade. Would you be willing to continiously trade a system like this? This is a question you have to answer for yourself, as it heavily influences which kind of system you should trade.
We can however at least approximate how long this system would work, and if we could select some values for the stop and the limit that would net us even more profit. To do this, we can run a backtest on this system over the course of a day or even a week.
Backtest
First of all, I ran an automatic backtest over the same timeframe, but with data from my broker. The result is:
10 trades. (8 failed)
total win:     30.00021
total loss:    39.9971
gross profit: -9.996891
net profit:   -17.909447
What happened? Well, my broker has a different spread than TradingView, leading to different prices, different candles, and different results for technical indicators.
You may say that is because the broker manipulates prices, and that might be true.
However, you will observe this in public stock exchanges as well. Compare any stock that is traded in different parts of the world, e.g. Amazon, and you will see slightly different prices and different charts. Among the reasons for this, one is: If an institutional buyer pushes the price of the stock with a large order, it will take some time for this information to reach the other part of the world. That is one reason why you see these differences.
That is why you should always test with data from your broker, not with free publicly available data.
Anyway, I adjusted the backtest for my broker by changing the stop/loss values. We are now accepting a risk of 6.5 CAD per trade, but we want 18 CAD in return. The result is:
8 trades. (5 failed)
total win:     53.99823
total loss:    32.50241
gross profit: 21.49582
net profit:   7.253788
The net profit assumes the German tax system, which is the worst tax situation I know of, therefore simulating the worst case.
So we get a profit of about 7 CAD within 2 hours. Let’s say we trade the system for 12 hours per day, does this equal 42 CAD per day?
Let’s look at the result for trading 12 hours:
50 trades. (40 failed)
total win:     179.9941
total loss:    260.01938
gross profit: -80.02528
net profit:   -127.49872
That is disappointing, but that is what you get from testing with a timeframe that is way too short.
What can we do now? There are several directions we can go from here:
- Adjusting stop/limit again – that would be overfitting.
- Adding another technical indicator to avoid the failing trades.
- Change the way the SMA is calculated. We are currently using the closing price, but we could use low/high or an average of both.
- Use a different timeframe, e.g. 5minutes.
TBC